Writing Guidelines
The writing guidelines of the University of Vaasa do not apply to doctoral theses.
The accessible version of the writing guidelines is in Word format.
In the writing guidelines you find information about the thesis layout, the use of references and the finishing touches of the text. The writing guidelines are also applied to other written work from the beginning of the studies. In this way, you get familiar with the writing guidelines before writing your thesis. The writing guidelines do not cover all possible cases. In uncertain cases, you should ask your thesis supervisor for advice.
(päivitetty 12.3.2024)
(päivitetty 8.6.2022)
Huomaa, että valmiista pohjasta huolimatta olet itse tekijänä vastuussa siitä, että noudatat työssäsi kirjoitusohjeita.
(updated 12.3.2024)
(updated 10.6.2022)
Please note that, regardless of the template, you are responsible for applying the writing guidelines in your work.
Overleaf (updated 2.5.2022) LaTeX template, that you can use for your own project.
Saavutettavasti.fi | Saavutettavat asiakirjat, Word (in Finnish)
Instructions (in Finnish) for making accessible Word documents. When the original Word file is accessible, it is possible to convert it to an accessible on PDF file. The instructions can also be downloaded from the page. Seminar papers that are saved for less than year do not need to be accessible.
Make your Word documents easy-to-use for disabled users.
The Language Centre Linginno is responsible for the writing guidelines of the University of Vaasa.

- Title page
-
The title page uses the font Calibri and the line spacing is 1.
1. The logo of the University of Vaasa is centered at the top of the page.
2. The name of the author of the work in font size 16 appears centrally in the middle of the page.
3. Below the name, the emboldened main title is written in font size 20. The subheading, if used, is written in font size 14.
4. On the right side of the cover page there is information about what type of work this is in font size 12.
5. At the bottom of the page, the last line is written centrally and gives the university's location: Vaasa 20XX (font size 12). The year is marked according to the year of approval of the thesis.

- Abstract
-
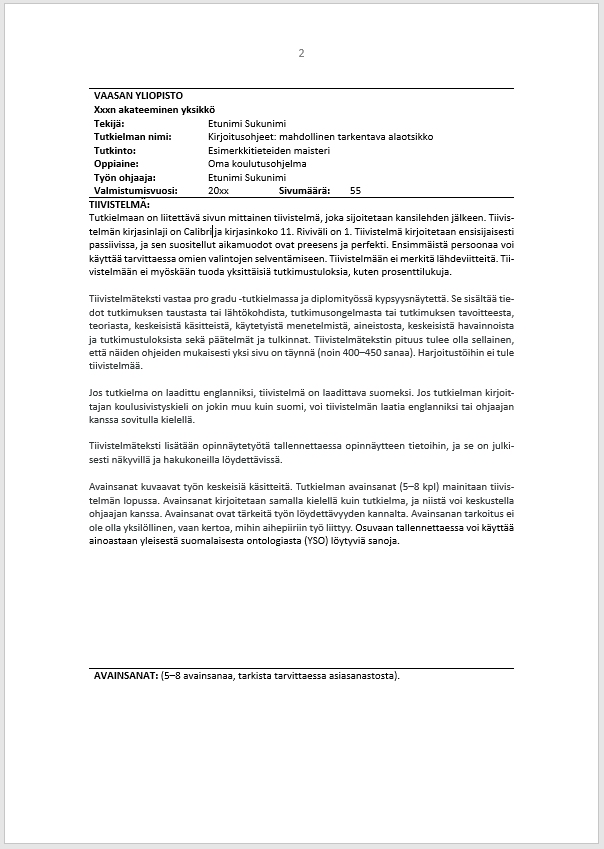
The thesis must be accompanied by a page-long abstract placed after the cover page. No abstract is included in the course assignments. In the beginning of the abstract you should include background information about the work and the writer.
Image
- The font of the abstract is Calibri, and the font size is 11. The line spacing is 1.
- The abstract is written primarily in the passive form and its recommended verb tenses are present and perfect. The first person can be used, if necessary, to clarify one’s own choices.
- No citations are included in the abstract. Also, specific research results such as percentages are not included.
- The abstract is equivalent to the maturity test in the master's thesis. It includes information on the background or starting point of the research, the research problem or research objective, theory, key concepts, methods used, data, key findings and research results, as well as conclusions and interpretations.
- The length of the abstract should be one full page (approximately 400-450 words), in accordance with these guidelines.
- If the thesis is written in English, the abstract must be written in Finnish. If the author has received his/her basic education in a language other than Finnish, the abstract may be written in English or in another language agreed on with the supervisor.
- Keywords describe the key concepts of the work. The keywords of the thesis (5–8) are listed at the end of the abstract. Keywords are written in the same language as the dissertation and can be discussed with the supervisor.
Image
- Page numbers and the table of contents
-
Page numbers
- After the title page, all pages are numbered sequentially so that the abstract is on page 2 and the table of contents is after the abstract page. If there is no abstract page, the table of contents comes after the title page, on page 2.
- The page numbering extends to the last page of the appendices at the end of the study.
- The page number is placed in the center of the page, 1.5 cm from the top of the page.
- The font for the page number is Calibri in font size 11.
Table of contents
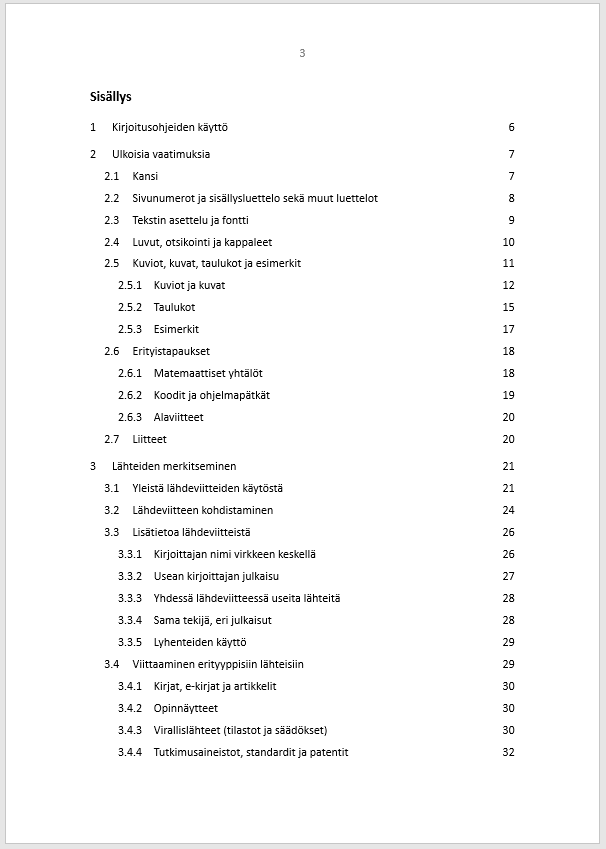
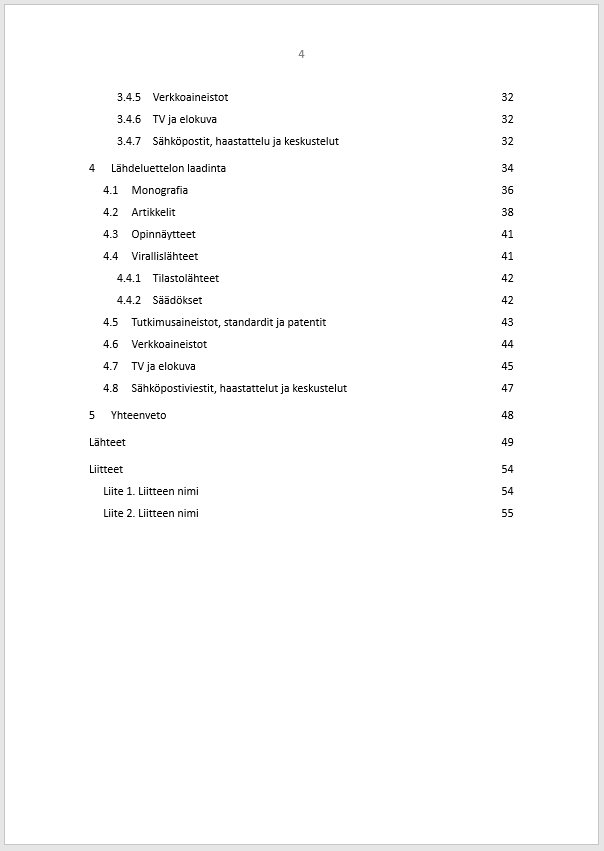
- The table of contents is titled "Contents".
- The line spacing is 1,5.
- In the table of contents, the content of the study is divided and organized by title and page number, following the consecutive order of the thesis.
- The subheadings are indented so that the two-stage subheadings are located 0.5 cm and the three-stage subheadings 1 cm from the left margin.
- The sources are placed at the end of the table of contents, followed by any other lists.
- In the table of contents, Sources and Appendices are not preceded by a number. If there is one appendix, it is entered in the table of contents as follows: Appendix. Title of the Appendix. If there are several, they are numbered consecutively.
- The table of contents does not use dotted lines between headings and page numbers.
- The abstract page is not included in the table of contents.
Image Image
Image
- Lists
-
- Lists of images, figures, tables, symbols, terms, and abbreviations are placed on a separate page after the table of contents.
- Images, figures and tables are listed one below another, by title and page number.
- List titles use font size 14 and are emboldened.
- The list does not include possible sources.
- If there are no more than three pictures, patterns or tables, they do not necessarily have to be presented in list form.
-
Signs, abbreviations, symbols, and terms that are unlikely to be self-evident to the reader are listed with explanations, in groups in alphabetical order: for example, first the Greek alphabet, then the Roman alphabet, and finally the abbreviations.
-
The list of abbreviations is titled Abbreviations, and includes established abbreviations, regulatory and other abbreviations used in the study.
-
For decrees, their full name is written together with their number. The abbreviations list only includes cases where an actual abbreviation has been used. For example, a decree is not included in the list of abbrevi-ations unless an abbreviation is used when referring to it.
-
When a list of abbreviations is used, the abbreviations do not need to be explained in the text.
-
If there are not many abbreviations, consider writing the full concept when first referring to it in the text, instead of creating a list of abbreviations.
Image
- Text layout and font
-
Text layout
- The text is positioned so that the left and right margins and the margins at the bottom and top are the same (3 cm).
- Both edges must be aligned.
- All written papers use a line spacing of 1.5.
- Line spacing 1 is used in the abstract, in codes, or in direct quotes longer than three lines. Line spacing 1 is also used in table, image and figure texts, examples and possible footnotes.
- In the source list, the line spacing is 1.5.
- Finally, no lines of text standing alone (so-called orphan lines) should be left at the bottom or top of the pages.
- The entire document is automatically hyphenated.
- No blank pages should be included.
Font
- The body of the thesis is written in the font Calibri and in font size 12.
- Bold font and italics are used in accordance with the supervisor's instructions. Italics often indicate the substance of the language (e.g., the word word contains four letters). In terms of accessibility, a bold font is better than italics.
- Underlining text is not recommended because underlining is often associated with a link.
- Colors may be used, but the use of these must not be the only way of conveying information.
- Efficiency measures must be used consistently when used, but should be used sparingly.
- Chapters, headings and paragraphs
-
- The text is divided into chapters, which are titled and numbered.
- By using the styles of the data processing program, the file becomes accessible. Heading design that has been created only by changing the layout is not permitted.
- All headings are in bold font and are preceded by two blank lines.
- After the heading there is always an empty line before the text.
Main chapters
- The titles of the chapters are written in font size 16.
- The main chapters (1) in the thesis begin on a new page. In other written works, the main title is separated from the preceding text by two blank lines.
Sub-chapters
- The sub-chapters continue on the same page as the preceding text.
- The titles of the two-stage sub-chapters are written in font size 14.
- There must be at least two sub-chapters. In other words, if there is a sub-chapter 1.1, there must also be at least one further sub-chapter, 1.2.
- The headings of two-stage subsections are separated from the previous text by two blank lines. If a two-stage sub-section follows the title of the chapter, one blank line between the titles is sufficient.
- In theses, however, it is recommended to have an introductory text between the main chapter and the sub-chapter.
Multi-stage subsections
- The headings of multi-stage subsections are written in font size 12.
- There must be at least two subsections.
- A multi-stage subsection is separated from the previous heading or text by two line breaks.
- A maximum of three steps (1.1.1) is the recommendation. A fourth level heading may be used if necessary, for clarity. Its layout corresponds to the third level heading.
Division into paragraphs
- The text is divided into paragraphs separated by a single blank line.
- Figures
-
The use of figures
- Figures can be used for illustration and simplification.
- Figures complement the text. Their content must be so precise that they can be viewed and understood without seeing the actual text.
- Figures must be clearly visible and appropriate in size. For example, they must not include unnecessary blank space and must fit within the set margins and on one single page.
-
Figures must either be the author's own or include the original source title and a reference. The source reference is marked according to the instructions (author, year and, if necessary, page number). For all figures, including those translated into or from Finnish by the writer, the original source must always be mentioned.
- In some cases, a figure or table can only be borrowed in part, in which case a reference is also made to the original source. In these cases, the text must clearly indicate what the author's own contribution is and what is borrowed from the original source. If the figure has been modified, the source is marked (adapted from…).
Layout of the figures
- Figures are separated from the body of text by one blank line above and below the figure.
- The title of the figure, i.e., the caption, is written below it and ends with a full stop. Any source references are included in parentheses after the caption. In this case, the caption ends at the full stop after the source reference.
- The text Figure 1. is in bold, but the caption itself is not in bold.
- The font is Calibri, the font size is 11, and the line spacing is 1.
- If the caption continues on the second line, it is indented to start at the same point as the caption on the first line.
- The caption should be described.
- The actual text should refer to each figure at least once. Figures must be adequately explained in the text.
- Figures must include alternative text, so-called alt text. The alternative text must state what information will be lost to the reader if the figure is not visible.
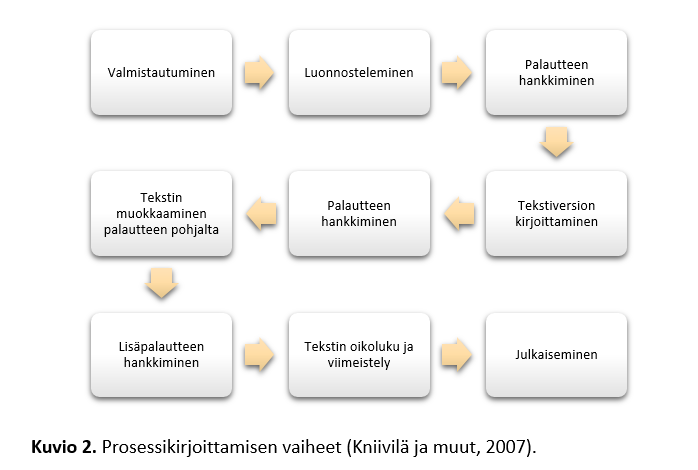
- When designing figures, keep in mind that even a small symbol has a significant impact. For example, the direction in which the arrow points will crucially change the content and meaning of the figure, as shown in Figure 2.
- Any technical drawings or diagrams must use standardized drawing symbols and symbols for physical quantities.
- Figures can also be presented in the appendices.
Image
- Images
-
The use of images
- Images, i.e., for example photographs or screenshots, should be used in the thesis only if the purpose of the thesis and the method used deem it necessary.
- The use of images is justified when it illustrates and clarifies one's own content.
- When using images, the copyright of the images must be taken into account. Photographs are likely to always exceed the so-called ‘work threshold’, in which case, permission to use it must be re-quested from the creator of the work. If the creator has transferred his/her rights to the work to another party, such as a publisher or producer, permission to use the work must be directed to them. Permits should be requested at the beginning of the thesis writing process, so that a possible prohibition to use the images can be taken into account when planning the research.
- In theses, images can be used to some extent within the so-called quoting right, without permission. The quoting right means that quotes from published works can be used for scientific presentation when the image is closely related to the subject matter discussed in the work.
- So-called illustration images must not be used.
- The source reference of the image is the name of its creator or of the publication in which it can be found.
If a figure or image has been created or edited using AI, a statement that AI has been used, including the prompt that was used, should be written in the caption under the figure or image, as seen in the example below.
Image 1. The future ad for Finland’s most popular coffee. NB: The image was created using AI, with the prompt: “Create an ad for Finland’s most popular coffee in 2045” (OpenAI, 2023).
The source used is included in the reference list, and the model creator, company or publisher is entered as author, along with a time reference (see chapter 4.8).
The layout for images
- Figures must be clearly visible and appropriate in size, and they should fit into the margins and on one single page.
- Images are separated from the body of text by one blank line above and below the figure.
- The title of the image, i.e., the caption, is written below it and ends with a full stop. Any source references are included in parentheses after the caption. In this case, the caption ends at the full stop after the source reference.
- The text Image 1. is in bold, but the caption itself is not in bold.
- The font is Calibri, the font size is 11, and the line spacing is 1.
- If the caption continues on the second line, it is indented to start at the same point as the caption on the first line.
- The caption should be described.
- The actual text should refer to each image at least once. Images must be adequately explained in the text.
- Images must include alternative text, so-called alt text. The alternative text must state what information will be lost to the reader if the image is not visible.
- Images can also be presented in the appendices.
- Tables
-
The use of tables
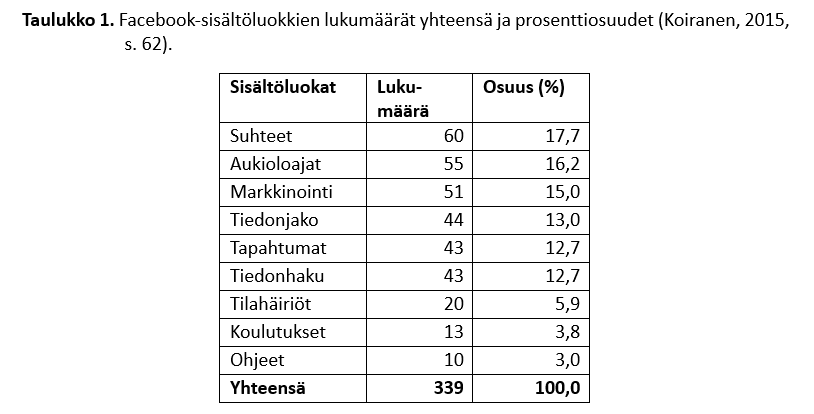
- Tables are also often used to present statistical data. Statistical data are presented as a separate table, either within the text or as an appendix. If the numerical data are scarce, they can also be presented untitled and unnumbered.
- The table consists of rows and columns in which the data are presented in a simplified manner.
- The same information must not be presented in both a table and a figure.
- In some cases, a table can only be borrowed in part, in which case a reference is also made to the original source. In these cases, the text must clearly indicate what the author's own con-tribution is and what is borrowed from the original source. If the table has been modified, the source is marked (adapted from…).
The layout for tables
- The actual text should refer to each table before the actual table is presented.
- The tables must be clear in appearance and appropriate in size.
- The tables must not have unnecessary blank space and must fit within the set margins and primarily on one page.
- The title bar of the table must be marked.
- Tables are separated from the body of text by one blank line above the table description and one below the table.
- The table description is written above the table and ends with a full stop. Possible source references are enclosed in parentheses after the table description. In this case, the description ends with a full stop after the source reference. If a table description continues on a second line, this is indented to begin at the same point as the text on the first line. If the table has been created or edited by using AI, a statement that AI has been used, including the prompt that was used, should be written in the table description above the table (cf. the example in chapter 2.5.1).
- The font is Calibri, the size is 11, and the line spacing is 1.
- The text Table 1 is in bold, but the description itself is not.
- For accessibility, the table header should be specified. Once the table has been created, mark the top line of the table as the title bar, as follows: Place the cursor on the top row of the table to display the Table Tools on the Word command line. From the table tools, select “Layout” and then select “Repeat Header Rows”. This will repeat the title bar of the table, even if the table is spread over several pages.
- Tables must include alternative text, so-called alt text. The alternative text must state what information will be lost to the reader if the image is not visible.
- The font of the table is the same as the font of the text, and depending on the size of the table, the font size can be either the same or smaller than the font size of the text.
- The layout of all tables used in the work should be consistent and excessive enhancement should be avoided. Tables should not be used merely to emphasize the appearance of text.
- The actual text should refer to each table, and each table should be explained sufficiently.
- Tables can also be presented in the appendices.
Image
- Examples
-
- All examples presented from the research material must be numbered consecutively, as the example below illustrates.
(1) However, neutral verbs may have their own function in referential structures in addition to communication. This is shown in example 1.
(1) Juha Korkeaoja, Deputy Chairman of the party's parliamentary group, said: “It would be worth asking those concerned first. That would clarify the situation considerably.” (Here information on the origin of the example is recorded, e.g., HS Sep-timber 2, 2017.)
In the example (1), saying something does not in itself form the core of the news, but − −.
- The examples must be distinguished from the rest of the text by indentation (1.5 cm: example number, 2.5 cm: example text). A more precise model for the spacing can be found on page 17 of the writing guidelines.
- Examples use line spacing 1.
- Usually, the example is not the last in the chapter, but text follows after it.
- All examples must be referred to in the text and also adequately explained. The interpretation of the examples should not be left to the reader.
- Examples are not marked by quotation marks and are not italicized.
- Special cases
-
The speacial cases concern in particular the fields of technology and law.
Mathematical equations
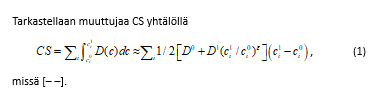
- Mathematical equations should be numbered consecutively and integrated in the text with normal spelling rules, including commas.
- Each equation is written on its own line and separated from the rest of the text by one blank line before and after.
- The sequential number of the equation is written in parentheses to the right, and the equation itself the beginning should be indented so that the equation part of all equations starts at the same point. This is illustrated in the image below.
Image
- The actual variable is introduced first, and the comma preceding the subordinate clause comes at the end of the equation.
- The quantities of the equation should be explained in connection with the equation only to the extent that they have not been previously explained in the text or in other equations.
- If the sentence does not continue after the equation, a full stop should be placed at the end of the equation. In this case, the possible source reference comes at the end of the text preceding the equation.
- A more detailed model for the settings can be found on page 18 in the Word document.
Standardised representations
- The mathematical representation shall use standardized signs and symbols, in so far as they exist. Standards can be found e.g., in the following publications:
- SFS-ISO 1000 + A1 (1999). SI units and recommendations for the use of their multiples and selected other units.
- SFS-ISO 31-0 + A1 (1999). Quantities and units. Part 0: General principles
- SFS-ISO 31-11 (1999). Quantities and units. Part 11: Mathematical signs and symbols in the physical sciences and technology.
- In the absence of standardized symbols, other established signs are used and as a last option individually created signs are used.
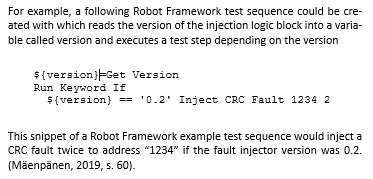
Codes and programme snippets
- The programme or programme snippet is indented and separated from the rest of the text by one blank line before and after.
- The font used is a flat-panel font, such as Courier, with the exception of pseudocode examples, for which it is recommended to use a relative font.
- If a programme snippet is less than ten lines, there is no need to create a title or list, as in the image.
Image
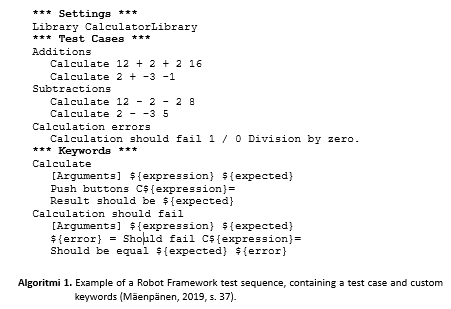
- If there are ten lines or more, they are treated as images or figures, i.e., they are named Algorithm 1. or Programme 1., as in algorithm 1.
Image
- If the code has been created or edited by using AI, a statement that AI has been used, including the prompt that was used, should feature in the description under the code (cf. the example in chapter 2.5.1). Other details in the field of technology can be obtained from the thesis supervisor.
Footnotes
- In public law, only statutes are referred to with in-text references, all other sources are marked with footnotes. In financial law, statutes can be referred to either by footnotes or in parentheses according to APA style. The chosen reference method must be used consistently throughout the work.
- When using footnotes, the number is entered before the full stop. The font size of the footnote is 10 pt and the line spacing is 1
- Thesis writers in the field of law should observe the established citation practices in their field. These are worth discussing with the supervisor before beginning the thesis work.
- Appendices
-
- Possible appendices are placed after the sources list in the thesis.
- They are titled, numbered consecutively, page numbered as well as listed in the table of contents.
- Appendices can be, for example, the questionnaires or interview forms used, other documents related to the collection of the material and possible examples of the material. The entire material is never enclosed to the thesis.
- Thesis appendices may also include figures and tables illustrating the content of the work that are too large to be included in the text.
- Referencing: in-text references
-
- The use of references is part of good scientific practice.
- References allow the reader to follow what source material has been used in the study and how it has been used.
- References allow the content of the text to be verified, and they enable the reader to identify when the author relies on the production of another researcher.
- All sources used are meant to be easily found in the source list.
- When using references properly, students demonstrate mastery of good scientific practice as an expert in their field.
- When citing sources, a distinction is made between references and direct quotes.
- When referring to a text, the central idea of one's own research design is formulated in one's own words.
- In the writing guidelines of the University of Vaasa, the APA 7 referencing style is applied.
- In the body of the text in-text references are used. References are either content-based or narrative references.
Content-based referencing
- In a content-oriented reference, the author, comma, blank space, time, comma, blank space, the abbreviation p. (for a single page) or pp. (for multiple pages), blank space, and the page (s) used are placed in a parenthesis.
- In a content-based reference, the & symbol is used inside the parentheses if there are two authors. If there are more than two authors, the abbreviation et al. is used.
Text text text text (Saleem & Larimo, 2016, p. 248).
Text text text text (Koskela, 2003, p. 22).
Text text text text (Kniivilä et al., 2017, p.54).
- The exact pages to which the citation refers are indicated in the parenthesis. The pages are separated by a dash –, which is one line longer than the common hyphen. When referring to the entire article, no page numbers are required. Instead of a page number, a chapter number or name, a slide number, a video timestamp, or a similar specification can be added to the source reference.
Text text text text (Koskela, 2003, pp. 222–224).
Text text text text (Saleem & Larimo, 2016, chapter 3).
- Sometimes not all source reference information is available. For example, if the date is not found on a website, the term n.d. (no date) is used. This abbreviation n.d. marked in both the citation and the bibliography.
Text text text text (Tiainen, n.d., p. 2).
Narrative referencing
- In a narrative reference the time and page(s) are placed inside a parenthesis.
- In a narrative reference, the symbol & is not used, but instead the word “and” is used.
According to Koskela (2003, pp. 222–224) [– –].
According to Saleem & Larimo (2016, chapter 3) [– –].
According to Kniivilä et al. (2017, p. 54) [– –].
Koskela (2003, p. 227) discusses [– –].
Saleem & Larimo (2016, p. 248) state that [– –].
Kniivilä et al. (2017, p. 78) define [– –].
- The exact pages to which the citation refers are indicated in the parenthesis. The pages are separated by a dash –, which is one line longer than the common hyphen. When referring to the entire article, no page numbers are required. Instead of a page number, a chapter number or name, a slide number, a video timestamp, or a similar specification can be added to the source reference.
According to Koskela (2003, pp. 222–224) [– –]
According to Saleem & Larimo (2016, chapter 3) [– –].
- In a narrative reference, it is possible to use various summarising verbs, such as to claim, state, present, and reflect.
Tiainen (n.d., p. 2) states that [– –].
- Referencing: direct quotations
-
- In direct citations, the source is cited in exactly the same form as in the original text.
- Direct quotations always include the page number.
- Direct quotes are marked with quotation marks if they are at least three words or are three lines long at most.
- The short quotation is separated from the text by quotation marks.
- Quotes longer than three lines are written in line spacing 1 indented (1.5 cm) and without quotation marks. However, long direct quotes should be avoided.
Luukka (1995) describes an approach to community in accordance with social constructionism:
Community members share similar values, beliefs, and practices that lead to, for example, common ways of speaking and norms. Management of these practices is a precondition for belonging to the community. Practices exist and emerge in the community and at the same time also shape the community. The community is therefore seen above all as a normative force. The interpretation of the text is canonical and the discourse normal if it follows community norms. (pp. 57–58)
OR
The approach to communality under social constructionism is described, for example, as follows:
Community members share similar values, beliefs, and practices that lead to, for example, common ways of speaking and norms. Mastering these practices is a precondition for belonging to the community. Practices live and emerge in the community and at the same time also shape the community. The community is therefore seen above all as a normative force. The interpretation of the text is canonical and the discourse normal if it follows community norms. (Luukka, 1995, pp. 57–58)
- Referencing: secondary sources
-
- The reference must be made to the source that has been used.
- The starting point is that the student uses primary sources.
- If the secondary source, i.e., a source by a second author, is used, this must be evident in the text.
Director Kilpeläinen (Kunelius, 2010) has concluded [– –].
Director Kilpeläinen has in Kunelius’s work (2018) concluded that [– –].
- The bibliography lists only the source that has been used concretely.
- The placement of references
-
- The source reference must indicate which part of the text in question is based on the source.
- If the reference concerns only one sentence, either a content-based or a narrative reference can be used in the text.
- It is important to note the scope of the of the reference which is illustrated in example
Here is an example of a paragraph that uses a content-based reference. If the source reference is marked as in this example, it means that only the last sentence is cited, and all other text represents the author's own voice. Thus, only this sentence is cited (Teikari, 1990, p. 60).
- When the source reference refers to only one sentence, the narrative reference may indicate page numbers or similar information either at the beginning of the sentence or at the end of the sentence.
- The full stop is placed after the parenthesis and the same full stop also ends the sentence.
- The image below illustrates content-based referencing regarding one single sentence as well as narrative referencing.
The concept of change communication has become increasingly criticized (Ahola & Zafar, 2010 p. 14–15).
Ahola and Zafar (2010, p. 14–15) assert that the concept of change communication has become increasingly criticized.
Ahola and Zafar (2010) assert that the concept of change communication has become increasingly criticized (p. 14–15).
- When the author uses a narrative reference and wants to focus on several subsequent sentences, the linguistic choices (text wording, vocabulary, theme) must inform the reader when the quoted part of the source work ends and when the author's own thoughts begin. This is illustrated in the image below.
- Saleem and Larimo (2016) reviewed 127 studies conducted between 1972 and 2002 that focused on examining the relationship between responsible business operations and their financial performance. Half of the studies supported their positive relationship, for some the result was neutral, but only a fraction of the studies produced a negative correlation between CSR and financial performance. However, the strong position of financial responsibility in the responsibility debate is not entirely unproblematic. This discussion is continued in the next section, which emphasizes the importance of a critical perspective.
- Koskela (2003) asserts that [– –]. He/she reminds readers [– –]. Additionally, he finds it important [– –]. Thus, the conclusion is that [– –].
- The scope of the reference can be clarified in the text by using transition words or contrasting expressions as on the other hand, however, or in my own work. The shift can also be indicated by a changing the tenses.
- If the same source is used in the first sentence of a paragraph and in the next sentence one’s own voice is used, after which the source of the first sentence is referred to again, the source reference must be fully rewritten.
- Similarly, if the same source is still used in the next paragraph, the source should be recorded again.
- To improve the readability of the text, both content-based and narrative referencing should be used alternately as demonstrated in the image below.
There are a few ways to construct a paragraph. According to Kunelius (2010, p. 14), when quoting a source for the first time, it is worth presenting the author’s name of the source. He also notes that for example, pronouns can be used so that there is no need to repeat the surname. After this another borrowed idea can be presented and the source reference given (Koiranen, 2015). The author's own idea can be added to this.
OR
Begin with your own thought, your own speech, or present the main idea as your own statement. According to Vartiainen (2020), one could then continue with another person’s voice. According to her, it can be done like this, for example. Ahola and Zafar (2010, p. 70) also state that it is worth beginning with one's own voice, continuing with another voice using a source reference, and then continuing again in one's own voice. On the other hand, there are other ways (Tiainen, 2018, p. 114). This is where the author’s own idea or the author’s conclusion (s) would begin. This way, dialogue can also be included in the text.
- It is important to note that the page number cannot be given as the only source in-formation in the sentence, but each sentence mentioning the page number must also include other source information (author, time).
- Referencing: variations
-
The author's name in the middle of a sentence
- An author's name may appear in the middle of the sentence, in which case the citation is immediately followed by the name. This is illustrated in the image below.
Text types can also be approached from the perspective of the sociology of knowledge: Günthner and Knoblauch (1995, p. 5) suggest that where there is socially relevant information to be “transferred”, there are also conventions.
- Using different ways of referencing in the same paragraph or text brings the text to life.
Publications by multiple authors
- If the same source has two authors, both authors are included in the citation. When the source reference is in parentheses, the ‘&’ character is used between the names. When the names are written in the body text, i.e., in the beginning or the middle of the sentence, the word and is written between the names.
- If the same source has three or more authors (more than two), only the surname of the first author is written in the text and parentheses, followed by "et al." in English text. This is illustrated in the image below.
Giles et al. (2015) consider the applicability of discourse analysis in the study of digital materials.
According to Giles et al. (2015) [- -].
In addition, the application of discourse analysis in the study of digital materials has been considered (Giles et al., 2015).
- If the first or first few authors are the same ones quoted from different sources, the authors must be indicated until the difference can be distinguished.
- The terms "and others" and "et al." are plural expressions, meaning that there must be at least two names to give. If this is not the case, the names of all the authors must be written.
- The names of the authors are listed in the order in which they appear in the source, i.e., they may not be changed to alphabetical order.
Multiple sources in one reference
- An idea presented in the same sentence or paragraph may relate to more than one source. In this case, the sources are marked in the same brackets in alphabetical order.
- It is important to note that all authors mentioned in the reference may not necessarily agree with all the information included in the paragraph which is why there may be cause for using separate references to indicate all the sources.
- The references are separated by semicolons. This is illustrated in the image below.
Communication as a discipline has been described by many names, from information science to media studies (see Ampuja et al., 2014; Karvonen, 2005; Väliverronen, 2000).
The same author, different publications
- Different publications by the same author are distinguished by years, which are listed in publication order.
- Publications of the same author from the same year are separated in the citations and bibliography by lowercase letters a, b, c, etc., as shown in the image below.
The diversity of social media as research material has been shown, for example, in Laaksonen (2016a; 2016b).
- Lowercase letters are added as publications are mentioned in the text: the first mentioned in the text is a, the second b, etc.
- If the sources have two authors with the same surname, the source reference is specified with the authors’ initials.
- If the year is unknown, enter n.d. -a, n.d. -b.
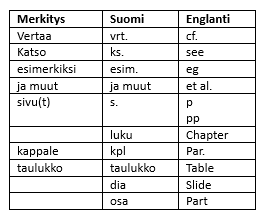
Using abbreviations
- Abbreviations can be used in references.
- The abbreviations are used in the language which the work is written in. Finnish abbreviations are used in Finnish texts in compliance with Table 2.
Image
- If necessary, a reference can be completed with e.g., the abbreviation cf. (compare). The abbreviation cf. emphasizes the fact that the reference discusses the topic from another perspective than the writer making the reference, does in his/her own work. Adding “see” to a reference, expresses e.g., that the topic discussed completes or supports the writer’s own text. It can also encourage readers to read about the topic in more detail in another source or in a different part in one’s own text.
- Citing different types of sources
-
Books, e-books and articles
- Today most source material is digital even if it consists of literature. Also, visual and audiovisual source material is increasingly used in theses.
- Books, e-books and articles are referenced as described in the section “Referencing”.
- For continuously updated e-books, both the original year of publication and the year of the most recent update shall be included. This is illustrated in the image below.
Text text text (Helminen, 2002/2019, chapter 6., Joint Ventures).
Helminen (2002/2019, chapter 6., Joint Ventures) writes [– –].
Theses and dissertations
- Theses and dissertations are cited in the same way as published books.
(Reijonen, 2018, p. 16).
In their dissertation, Brown (2019) states that [– –].
- Doctoral dissertations are academic publications. It is advisable to ask the thesis supervisor whether or not it is acceptable to use lower level theses, such as Master’s theses, as sources in one’s own dissertation or thesis.
Official sources (statistics and legislation, such as statutes and decrees)
- Finlex is an online database of up-to-date legislative and other judicial information of Finland. When using printed books of laws, statutes and decrees, please note that the information may be outdated.
- Citing a law, statute or decree for the first time in the text:
According to the Act on Financial Aid for Students (1994/65) 15 f §, [– –].
Text text text (Act on Financial Aid for Students 1994/65, 15 f §).
- Citing the same law again in the same text:
Text text text text (AFAS 15 f §).
OR
Text text text text (Act on Financial Aid for Students 15 f §).
- Citing several sections/paragraphs of law:
(AFAS 15 a §, 15 b §).
- Citing parliamentary documents such as government proposals, committee reports and statements:
(GP 55/1994 vp p. 5).
(PeVL 15/2000 vp p. 1).
- Use the abbreviation CD when citing committee deliberations
(CD 1988, 11 p. 25).
- Cite statistics with the author (publisher) of the statistic, its publication year and page number. Statistical sources usually have a corporate author.
Every other Finn follows at least one social networking site online (Statistics Finland, 2013, p. 13).
- The author of statistics is usually a community or an institution. Half of the Finns follow at least one community service on the Internet.
- More examples of referencing official sources are available in the Word document version of the writing guidelines.
Research material, standards, patents
- Cite research material, standards and patents in the following ways:
(Finnish Standards Association SFS, 2017).
In the Finnish Standards Association SFS (2017) standards [– –].
(Arrasvuori et al., 2019).
In the patent by Arrasvuori et al. (2019) [– –].
Online material
- Online material tends to be very varied in content and level of reliability, ranging from ministry reports to private blogs. It is advisable to practice caution when using online material and consult the thesis supervisor in any unclear cases.
- The reference includes only the publication year. If the date is known, it is not included in the in the in-text citation, only in the reference list entry.
TV and films
- The author is usually the director.
Emails, interviews and discussions
- Personal communication comprises emails, unarchived forum messages, personal interviews, phone conversations and other equivalent discussions.
(S. Smith, personal conversation, 11.12.2019).
- Personal communication is not included in the list of references.
- Publications aimed at a professional and wider audience on online pages with limited accessibility, such as Moodle or the intranet of a company, are categorised as personal communication. Personal communication sources can be cited in the same way as online sources in all papers and Bachelor’s and Master’s theses written at the University of Vaasa.
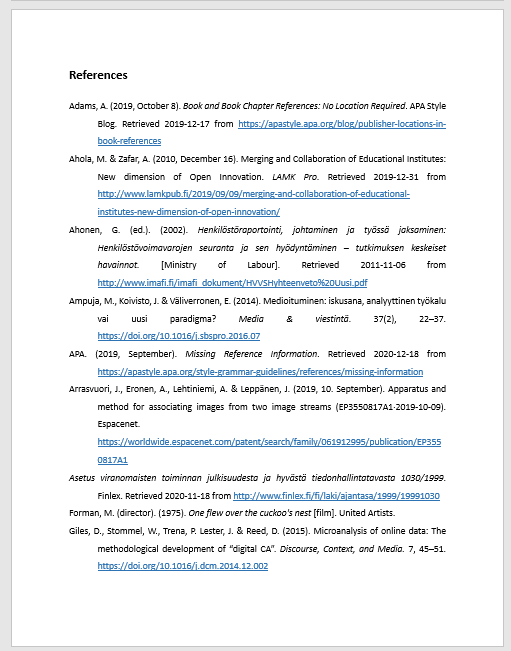
- Compiling a list of references
-
- All the cited sources are compiled into a list of references, and correspondingly, each entry in the list of references must be cited in the text of the paper or thesis. The in-text citation and the beginning of the reference list entry must match.
- The list of references is placed after the text of the paper or thesis, but before the appendices.
- The line spacing of the list is 1,5 and there is no empty line between the reference entries.
- All references (including, for example, research material sources) are compiled into one list in alphabetical order.
- Publications by the same author are listed by time from the oldest to the most recent one.
- In the reference list, the lines following the first line are indented (1,25 cm).
The elements of the reference list
- The list of references must include the following elements, in the given order and with the details required for the particular type of source.
Image Image
Image
- The first element is the author. This means the writer, editor, director, photographer or other creator of the source. The list of references is alphabetised according to this element. When there are 20 or fewer authors, all of them are included in the reference entry and an ampersand (&) is added before the last author’s name. If there are 21 or more authors, the first 19 are listed after which there is a comma and a space, three full stops, a space, and after that the very last author’s name.
Image
- The second element is time. This means the publication year of the source. The year is given at least to the nearest year, but with online material even greater accuracy is often needed. If the publication year is not available (for example in the case of websites), it is indicated with n.d.
Image
- The third element is the title. This means the title of the book, article, blog post, photograph, etc.
-
Image

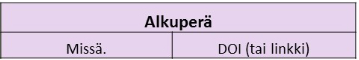
- The fourth element is the origin of the source. This means the publisher, journal, compilation book, or website. If the name of the website is the same as the author element, it does not have to be repeated. The DOI and the URL address belong to this element. If a book or an article has a permanent identifier (DOI, URN), it should be used also when referring to a printed book. A permanent identifier is written into the list of references as a URL (DOI https://doi.org/10.1007/978-3-658-15220-8_18 or URN http://urn.fi/URN:ISBN:978-952-476-861-0). If a source has a permanent identifier, the reference entry does not have to include the retrieval date or information regarding an online source. Such a source is comparable to a printed source and the reference entry can be created accordingly. When a source has no permanent identifier, only an ordinary web address, the reference needs more information. In such a case, the reference entry has to include the retrieval date on which the source was viewed so that the reader can compare whether the page has been updated since then. Additionally, the phrase “Retrieved from” is placed before the URL.
- There is a full stop after each element, unless the element itself ends in a full stop, exclamation mark or question mark, for example Surname, A.A. No full stop is added after web addresses.
- An automatic line break inserted into the link by Word (or some other word processing programme) is acceptable. However, the author of the thesis should not manually insert line breaks into URL links because it must be ensured that the links work properly in the final version of the thesis.
- Reference list and referencing: missing information
-
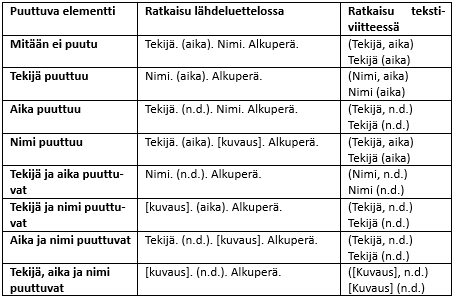
- Sometimes some of these listed elements are not available. Table 3 below displays how to write a reference list entry when one of the elements is missing. In the in-text citations, page numbers are always mentioned if they are available.
Image
- Limited access to the source
-
- If access to the source material is limited to a specific group of users, for example the employees of a company (a company intranet) or the participants of a course (Moodle), such sources are referred to and cited in the same way as ordinary web pages.
- However, the reader must be notified about the restricted availability, for example by adding [restricted availability] in the reference entry. This particular instruction concerns only papers and theses written at the University of Vaasa.
- If the paper is a professional publication, sources such as these are categorised as personal communication and they are not listed in the references.
- Different types of sources in the reference list
-
Monography
- A monography is a research publication about a specific, coherent topic written by a single author or a group of authors.
- It can be a printed book or an e-book, and sometimes it can be published in both formats.
- Both versions are referred to and cited in the same way.
- If a printed book has a permanent identifier, such as DOI or URN, it is included in the list of references as a link with a https:// prefix.
- If the e-book link is not a direct link to the book, or the name of the database is not useful to the reader, they are not included in the list of references.
- The place of publication is not included in a reference entry.
- A monography is listed in the references in the following way:
Last name, A. A. (Year). Title of the book. Publisher. https://doi.org/10.xxx
______________________________________________________________________
Kunelius, R. (2010). Viestinnän vallassa. Alma Talent Oy. http://urn.fi/URN:ISBN:978-952-476-823-8
Piippo, I., Vaattovaara, J. & Voutilainen, E. (2016). Kielen taju. Retrieved April 17, 2020 from http://www.imafi.fi/imafi_dokument/HVVSHyhteenveto%20Uusi
Slade-Brooking, C. (2016). Creating a brand identity: A guide for designers. Laurence King Publishing.
______________________________________________________________________
- Surnames with a prefix are usually placed alphabetically in accordance with the actual surname, not the prefix. In such cases, the prefix is placed after the surname.
Image
- Names originating from different countries have different practices so when referencing such a name, the writing and reference practice must be verified preferably from the author’s own information. In Finnish and English aristocratic prefixes (von, de, af, etc.) are as usual written with capital letters in the beginning of a sentence.
Monography: two or more works by the same author published the same year
- If two or more works by the same author published the same year are used, these are listed alphabetically and separated by a lower case letter in connection to the year (a, b, c). This also applies to articles.
Image
Monography: a chapter in an anthology
An anthology is a work consisting of independent chapters written by different authors. In this case the reference is made to the author of the chapter.
Surname, A. A. & Surname, B. B. (Year). Title (edition). In E. E. Editor (Ed.), Title of the book (pp. 1–123). Publisher. https://doi.org/10.xxx
______________________________________________________________________
Saleem, S. & Larimo, J. (2016). Hofstede Cultural Framework and Advertising Research: An assessment of the literature. In G. Christodoulides, A. Stathopoulou & M. Eisend (Eds.), Advances in Advertising Research (Vol. VII): Bridging the Gap between Advertising Academia and Practice (pp. 247–263). Gabler Verlag. https://doi.org/10.1007/978-3-658-15220-8_18
Monography: the author is also the editor of the anthology
Surname, C. C. (Ed.). (Year). Title of the book. Publisher. https://doi.org/10.xxx
______________________________________________________________________
Ahonen, G. (Ed.). (2002). Henkilöstöraportointi, johtaminen ja työssä jaksaminen: Henkilöstövoimavarojen seuranta ja sen hyödyntäminen – tutkimuksen keskeiset havainnot. [Ministry of Labour]. Retrieved 2020-06-11 from http://www.imafi.fi/imafi_dokument/HVVSHyhteenveto%20Uusi.pdf
Articles
Surname, A. A. (Year). Name of the article. Journal title, volume(number), 1–123. https://doi.org/10.xxx
______________________________________________________________________
Kazmi, S. A. Z., Naaranoja, M., & Kytölä, J. (2016). Integrating strategic thinking and transformational leadership for NPD idea support process. Procedia - Social and Behavioral Sciences, 229, 387–397. https://doi.org/10.1016/j.sbspro.2016.07
- If an article has a permanent identifier (DOI, URN) it must be included in the reference entry of its printed version.
Surname, A. A. (Year, DD. Month). Article title. Newspaper/magazine title, volume(number), 1–123.
______________________________________________________________________
Tiainen, A. (2018, 15. September). Ihminen ajattelee, tekoäly suorittaa. [Interview with brain specialist Henning Beck]. Helsingin Sanomat, pp. D14–D15.
- When an article is only available online and it has no permanent identifier, the reference entry must include the retrieval date on which the source was viewed so that the reader can compare whether the page has been updated since then. The retrieval date is written in the following way: Retrieved yyyy-mm-dd from URL
Last name, A. A. & Last name, B. B. (Year, DD. Month). Article title. Newspaper/magazine title, volume(number), 1–123. http://xxx
______________________________________________________________________
Ahola, M. & Zafar, A. (2010, 16. December). Merging and collaboration of educational institutes: New dimension of open innovation. LAMK Pro. Retrieved 2019-12-31 from http://www.lamkpub.fi/2019/09/09/merging-and-collaboration-of-educational-institutes-new-dimension-of-open-innovation/
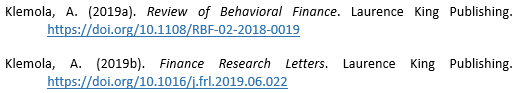
- If the source is an article which was published online before the publication of the journal in which it appears, and the more detailed publication information and page numbers are not available, the article may be accompanied with phrases such as "online first publication", "advance online publication", "In Press, Corrected Proof" or "Ahead-of-print". These phrases are combined in the citation into “advance online publication”. The reference entry is written in the following way:
Klemola, A. (2019). Small investors’ internet sentiment and return predictability. Review of Behavioral Finance, advance online publication. https://doi.org/10.1108/RBF-02-2018-0019
Newspaper article
Surname, A. A. (Year, DD. Month). Title of the newspaper article. Title of the newspaper, volume(number), 1–123. https://link.address
______________________________________________________________________
Vartiainen, P. (2020, 27. January). Palvelujen valinnanvapaus: sumua ja vaikeita termejä. Ilkka-Pohjalainen, p. 16. Retrieved 2020-12-18 from https://ilkkapohjalainen.fi/xxx
Article: an article in an anthology
- A compilation is a work consisting of independent articles written by several different authors. In this case the reference is made to the author of the article.
Surname, A. A. & Surname, B. B. (Year). Title of the article. In E. E. Editor (Ed.), Title of the anthology (pp. 1–123). Publisher. https://doi.org/10.xxx
______________________________________________________________________
Saleem, S., & Larimo, J. (2016). Hofstede Cultural Framework and Advertising Research: An assessment of the literature. In G. Christodoulides, A. Stathopoulou & M. Eisend (Eds.), Advances in Advertising Research (Vol. VII): Bridging the Gap between Advertising Academia and Practice (pp. 247–263). Gabler Verlag. https://doi.org/10.1007/978-3-658-15220-8_18
Article: blog posting
Last name, A. A. (Year, DD. Month). Title of the blog post. Name of the blog. https://link.address
Ouellette, J. (2019, November 15). Physicists capture first footage of quantum knots unravelling in superfluid. Ars Technica. Retrieved 2020-12-10 from https://arstechnica.com/science/2019/11/study-you-can-tie-a-quantum-knot-in-a-superfuid-but-it-will-soon-untie-itself/
Theses and dissertations
- If a thesis has no permanent identifier, such as URN or DOI, the phrase “Retrieved yyyy-mm-dd from” is added before the URL link.
- Doctoral dissertations are academic publications. It is advisable to consult the thesis supervisor to ask whether or not it is acceptable to use lower level theses, such as Master’s theses as sources in one’s own dissertation or thesis.
Surname, A. A. (Year). Title of the thesis [Level of the thesis, Name of the university]. Name of the database. https://urn.fi/URN:xxx
______________________________________________________________________
Perttola, L. (2019). Kynnyksen yli: julkisoikeudellinen tutkimus vanhuspalvelujen saamisen edellytyksistä [Doctoral dissertation, University of Vaasa]. Osuva. http://urn.fi/URN:ISBN:978-952-476-896-2
Reijonen, J. (2018). Decentralized machine learning for autonomous ships in distributed cloud environment [Master’s thesis, University of Vaasa]. Osuva. Retrieved 2019-12-31 from https://osuva.uwasa.fi/handle/10024/9493
Salo, M. (2015). Hyvä liiketoimintapäätös ja johdon vastuu [Doctoral dissertation, University of Vaasa]. Talentum.
Official sources
- The author of a source can also be corporate. When a source has no specified author, it is listed either by its publisher or its title. The method of listing such sources must be consistent and follow the overall method of reference listing.
Lainlaatijan opas. (2012). Ministry of Justice. http://urn.fi/URN:ISBN:978-952-476-896-2
Ministry of Justice. (2012). Lainlaatijan opas. https://doi.org/10.1007/978-3-658-15220-8_18
Kielitoimiston sanakirja. (2020). Opponentti. Retrieved 2020-10-4 from https://www.kielitoimistonsanakirja.fi/#/opponentti
Statistics
- If the in-text citation mentions the name of the publisher, the following information is included in the reference list entry:
Institution. (Year). Title of the statistics. Name of the publisher. https://urn.fi/URN:xxx
______________________________________________________________________
Statistics Finland. (2013). Yhteisöpalvelut istuvat suomalaiseen sosiaalisuuteen. Retrieved 2017-12-12 from http://www.stat.fi/artikkelit/2013/art_2013-06-03_001.html
______________________________________________________________________
Official sources: Statutes and decrees
- If legal statutes or decrees are included in the reference list, the reference entry should include the full title of the statute or decree, the date of issue, slash, the number of the statute, the name and origin of the publisher.
______________________________________________________________________
Act on Financial Aid for Students. 21.1.1994/65. Finlex. Retrieved 2020-12-11 from https://finlex.fi/fi/laki/ajantasa/1994/19940065#L2P15b
Decree on the Openness of Government Activities and on Good Practice in Information Management
1030/1999. Finlex. Retrieved 2020-11-18 from http://www.finlex.fi/fi/laki/ajantasa/1999/19991030
______________________________________________________________________
- Usually statutes and decrees are not included in the list of references. It is advisable to consult the thesis supervisor for the correct procedure for the field of study in question. The reference list entries for other official sources must correspond to what is included in the in-text citation. Committee deliberations are an exception to this. They are entered in the list of references with their full name instead of the abbreviation ’CD’.
_____________________________________________________________________
GP 248/2001 vp. Hallituksen esitys Eduskunnalle laiksi seutuyhteistyökokeilusta.
Committee Deliberation. 1992: 3. Perusoikeuskomitean mietintö. Ministry of Justice.
_____________________________________________________________________
- The thesis supervisors will provide more information on this.
Research material, standards, patents
Surname, A.A, & Surname, B.B. (2010) Name of the material (version) [data]. Publisher’s name. https://urn.fi/URN:xxx
Arrasvuori, J., Eronen, A., & Leppänen, J. (2019, Setember 10). Apparatus and method for associating images from two image streams (EP3550817A1.2019-10-09). Espacenet. https://worldwide.espacenet.com/patent/search/family/061912995/publication/EP3550817A1
Corporation. (2010). Name of the material (version) [data]. Publisher’s name. https://urn.fi/URN:xxx
Statistics Finland, Ek, K. & National Land Survey of Finland. (2015). Paavo – Postinumeroalueittainen avoin tieto, 2015 [data material]. Tieteen tietotekniikan keskus Oy, Etsin. https://urn.fi/urn:nbn:fi:csc:-kata000010000000000000000567
Organisation. (2010). Name of standard (number).
Finnish Standards Association SFS registered association. (2017). Pienjännitesähköasennukset: Osa 1-1, Yleisvaatimukset (SFS 6000 Osat 1-6) = Low-voltage electrical installations: Part 1-1, General requirements (SFS 6000 Parts 1 to 6).
Online material
- It is advisable to practice caution when using online material.
- URLs are automatically divided by the word processing programme used, not by the author of the written work. This way the link is accessible in the final work.
- The heading is italicized for online material, but the name of the web page is not.
Surname, A.A, & Surname, B.B. (2010, October 8). Name of the article. Name of the web page. https://URL
Adams, A. (2019, October 8). Book and book chapter references: No location required. APA Style Blog. Retrieved 2019-12-17 from https://apastyle.apa.org/blog/publisher-locations-in-book-references
Surname, A.A, & Surname, B.B. (2010, October 8). Heading of the text. Name of the web page. https://URL
Malminen, U. (2019, October 7). Helsinki luopuu koulujen Wilma-järjestelmästä muutaman vuoden sisällä – parin miljoonan käyttäjän Wilma ei lähtenyt mukaan kaupungin kilpailutukseen. Yle. Retrieved 2019-10-08 from https://yle.fi/uutiset/3-11008546
Corporate author. (Year). Title of the text. Name of the web page. https://URL
Finish Competition and Consumer Authority. (2017). Kuluttaja-asiamiehen linjaus: Maksaminen verkkokaupassa. Retrieved 2018-10-28 from https://www.kkv.fi/ratkaisut-ja-julkaisut/julkaisut/kuluttaja-asiamiehen-linjaukset/aihekohtaiset/maksaminen-verkkokaupassa/
Lampimäki, H. (2018). Johtamisen perusteet ayJOHT1010 [lähitapaamisten materiaali]. Moodle. [Restricted access]. Retrieved 2018-10-30 from https://moodle.uwasa.fi/pluginfile.php/185252/mod_folder/content/0/Johtamisen_perusteet_25092018.pdf?forcedownload=1
@screen name. (2010, May 12). Heading of the text.[description of the media]. Name of the web page. https://URL
Tritonia [@TritoniaLib]. (2021, January, 22). #univaasa Access to Oxford University Press Journals now available! 368 journals in social sciences, law, science & mathematics, and more. Link [Tweet]. Twitter. Retrieved 2021-01-27 from https://twitter.com/TritoniaLib/status/1352581833884651521?s=20
TEDx Talks. (2017, December, 13). Susanna Kultalahti: Messages from generation y [video]. YouTube. Retrieved 2017-12-22 from https:// youtube/hwhpw9
Name of channel. (2010, May 12). The first 20 words of the posting. [description of the voice]. Name of the web page. https://URL
University of Vaasa. (2020, December 23). Vaasan yliopiston tutkimusalustat ovat alkaneet kiinnostaa aluesuunnittelijoita ja innovaatiopolitiikan toteuttajia Itämeren alueella ja EU:ssa, kertoo aluetieteen professori Seija Virkkala. Read [Image][Link to external web page]. Facebook. Retrieved 2021-01-27 from https://www.facebook.com/univaasa/posts/10160621238227627?__cft__[0]=AZXbHe_j-3yEYdF7wQLSZq8kA0A_AJexBLki0P2b-TDFZZYCbwlcj555DBop9Oo0GVQ0B7x0as3gs4NO-l93V-VsI3Jki_uQdwwoztu1vkKnwSYrjuAqeS4aOus0pQsWYdOTgmDXyILPisevm_Y6wVhE&__tn__=%2CO%2CP-R
TV and films
- Films, songs, musical performances, TV and radio programmes and images and videos published online are all possible sources of a thesis.
- If the analysis covers several films or TV programmes, they are listed as research material appendix. This rule concerns also videos that are published for example on YouTube if they are used as research material.
- The author of such sources is usually the director. The author can also be the producer, the host or the person who posted the material online.
- Since many sources accessed via a streaming service may be available only for a limited time, no URL link is included in a streaming service source reference.
Director, D. D. (Year). Title of the film. Production company.
______________________________________________________________________
Forman, M. (Director). (1975). One flew over the cuckoo's nest [film]. United Artists.
______________________________________________________________________
Director D. D. (Year, DD. Month). Title of the episode (Season number, episode number). In Title of the series produced by P. P. Producer. https://link.address
___________________________________________________________________
Grönberg, M., Nevakare, H. & Urhonen, M. (Eds.), (1988, May 18). Jäähyväiset Hittimittarille (Episode 61). In Hittimittari series. Retrieved 2017-05-06 from http://areena.yle.fi/1-2749009
______________________________________________________________________
Director, D. D. (Year, DD. Month). Title of the episode (Season number, episode number). In Title of the series produced by P. P. Producer, Production company.
______________________________________________________________________
Lund, P. (Director). (2017, May 26). Lauran päivä, (Season 6, Episode 12). Vain elämää produced by Banijay Finland. Nelonen.
______________________________________________________________________
Poster, P. P. (Year, DD. Month). Title of the Youtube video. Title of the web page. https://link.address
______________________________________________________________________
University of Vaasa. (2019, January 23). Univaasa – Agents of change [video]. YouTube. Retrieved 2019-12-17 from https://youtu.be/VLO63lQ29Eo
______________________________________________________________________
Artificial intelligence
- Artificial intelligence (AI) is not a scientific source, and therefore should not be used as a reference in scientific research. If AI has been used when writing a thesis, the writer must tell their supervisor how AI has been used, and discuss with them how this usage should be reported.
- It is however possible to use AI to create and edit pictures, figures, tables or codes, for example. If AI has been used in the creation or editing of a picture, figure, table or code, AI must be added to the reference list.
- The model creator, company or publisher should be entered as author in the reference list.
Model creator/company/publisher. (publication year). Name of AI (publication date of the version) [description]. Retrieved 2023-12-01 from https://link.address
______________________________________________________________________
OpenAI. (2023). ChatGPT (2023, 14. January) [Large language model]. Retrieved 2023-12-01 from https://chat.openai.com/chat
______________________________________________________________________
Emails, interviews and discussions
- Personal communication comprises emails, unarchived forum messages, personal interviews, phone conversations and other equivalent discussions. Personal communication is not included in the list of references.
- Publications that are aimed at professionals or readers from the general public, for example, online pages with limited accessibility, such as Moodle or the intranet of a company, are categorised as personal communication. Personal communication sources can be cited in the same way as online sources in all papers and Bachelor’s and Master’s theses written at the University of Vaasa.
- FAQ
-
Why does the text in the writing guidelines not follow the APA style?
The layout follows the University of Vaasa’s own guidelines, and the APA style is only the basis for the referencing. Dissertations follow the University of Vaasa’s own guidelines for publications.
On the abstract page there is a field titled: Discipline: Own degree programme. Which option should be written in this field, the discipline or the degree programme?
The practices vary greatly. Some indicate the actual discipline while others fill in their degree programme. Verify with your supervisor which option is used in your unit.
In which language is the abstract written?
If the thesis is written in English, the abstract is written in Finnish. If the writer has received their basic education in another language than Finnish, the abstract can be written in English, or a language agreed with the supervisor.
Should there be a blank space or line after the title? This is what the instructions say, but in the template, this is not the case.
Yes, there is a blank line after the title. In the template the blank line is already included in the font of the heading. The template does not automatically follow the writing guidelines which means that you are responsible yourself for your work following the guidelines. This means that even the template must sometimes be edited. It is worthwhile reading the guidelines carefully in order to be able to compare where the template must be changed to follow the instructions.
What kind of emphasizing methods can be used in text, and can they be used?
The body of the thesis is written in the font Calibri and in font size 12. Bold font and italics are used in accordance with the supervisor's instructions. Italics often indicate the substance of the language (e.g., the word word contains four letters). In terms of accessibility, a bold font is better than italics. Underlining text is not recommended because underlining is often associated with a link. Colors may be used, but the use of these must not be the only way of conveying information. Efficiency measures must be used consistently when used but should be used sparingly.
Consult your supervisor whether using emphasis methods is appropriate in your work.
My work contains many different images. Do images have to be categorized in some way?
If the images, figures and tables are no more than three, they do not necessarily need to be listed. If there are more images (and other illustrations), listing is needed. These lists can include images, figures, tables, terms and abbreviations. They are placed after the table of contents on their own page. Images, figures, tables are listed in the order they are appear with a title and page number. The font size of the list headings is 14 and they are written in bold letters. The lists do not include possible sources.
What is the layout for examples?
All examples presented from the research material must be numbered consecutively. The examples must be distinguished from the rest of the text by indentation (1.5 cm: example number, 2.5 cm: example text) and line spacing 1. Usually, there is text after an example, it is not the last part of a chapter. All examples must be referred to in the text and adequately explained. The interpretation of the examples should not be left to the reader. Examples are not marked by quotation marks and are not italicized.
What does alt text mean?
Images, figures and tables must have an alternative text, a so called “alt text”. The alternative text must provide the information the reader does not get if the image or figure cannot be seen.
Why does the work need to be accessible and how is the work made accessible?
Accessibility means e.g., that the content of the work can be accessed with the help of technical aids such as screen readers, readers can easily move from one title to another and the essential content has been given in alternative ways, when necessary, i.e., for example the content of the pictures has also been told in text. According to the law, theses must be accessible.
Issues to consider in the accessibility of the work
- By using the styles of Word program, the file can be accessed. Formatting the title by simply changing the appearance is not allowed.
- Figures, images and tables must have an alternative text, a so-called alt text. The alternative text must explain what information the reader will miss if the image or figure is not visible.
- Captions and header lines of the tables must be defined. This way, the header row of the table is repeated, even if the table is spread over several pages.
- The web addresses of the source list are marked as hyperlinks to the work, so that access to the source material is effortless.
I couldn't get the list of figures/tables in the ready-made Word template to work. Is it a big mistake to make a table without an existing tool?
For accessibility reasons, look at the instructions on the Saavutettavasti.fi website, in Finnish, (heading Make tables in Word).
How do I reference the source for a figure if I have modified the figure based on different sources?
The original source must always be mentioned in all images, figures and tables, including translated ones. If an image, figure or table has been modified, the source is indicated as adapted from…”.
What is the line spacing in the reference list and how are the sources separated?
The line spacing in the list of sources is 1.5, and no empty lines are left between different sources. Sources are separated using hanging indentation.
What kind of information should be included as appendices?
Possible appendices are placed in the work after the reference list. They are titled, numbered consecutively, paginated and also listed in the table of contents. For example, the questionnaires or interview forms used, other writings related to the collection of material and possible examples of the material can be included as an appendix. The entire material is never attached to the work. Appendices to the work may also include figures and tables illustrating the content of the work, which are too large to be placed in the text.
What does a content-based or narrative reference mean?
A content-based reference
Text text text text (Saleem & Larimo, 2016, p. 248).
A narrative reference
Saleem and Larimo (2016, p. 248) assert that [– –].
According to Koskela (2003, p. 225) [– –].
When is the & symbol used in references and when is the word and used?
The & symbol is used only with references within parentheses (content-based references) and the and word is used in a narrative reference. In the reference list the & symbol is used. A template and further information can be found in the Word document version of the writing guidelines.
If there are several authors, should they be mentioned in the first reference?
If there are several authors (more than two), they are referred to as et al., e.g. According to Kunelius et al. (2020, p. 54) … or (Kunelius et al., 2020, p. 54). All authors are not mentioned even in the first reference.
If there are only two authors, then the & symbol is used (Kunelius & Piha, 2020, p. 12) in a content-based reference whereas in a narrative reference the word and is used, according to Kunelius and Piha (2020, p. 12) [– –].
What is the procedure to follow if the sources have no date?
If the time (year) cannot be found, the expression n.d. (no date) is used. In the writing guidelines there are instructions on how to proceed when some of the source elements are missing.
What if the sources have the same name and have been published the same year?
Publications of the same author from the same year are separated in the references and reference list by lowercase letters a, b, c, etc. Lowercase letters are added as publications are mentioned in the text: the first mentioned in the text is a, the second b, etc. If the sources have two authors with the same surname, the source reference is specified with the authors’ initials. If the year is unknown, enter n.d. -a, n.d. -b.
How are direct quotes marked?
In direct citations, the source is cited in exactly the same form as in the original text. Direct quotes are marked with quotation marks if they are at least three words long, or three lines long at the most. A short quotation is separated from the text by quotation marks. Quotes longer than three lines are written in line spacing 1 indented (1.5 cm) and without quotation marks. However, long direct quotes should be avoided. If the source text contains a typo, it can be indicated in a direct quote by marking [sic] after the incorrect word. Sic (Lat.) = Thus, in that way; indeed so. Direct citations always include the page number of the source.
I am writing my Bachelor’s thesis in Finnish, but I would like to add a direct quote which is in English. Do I have to translate the quote into Finnish myself?
Direct quotes are cited in the exact same form as in the original text. The exact same form also means that the language is the original one. The reader must not be left to interpret the text, which means that the quote must discussed in a way that makes the message of the quote clear to the reader. A Finnish translation or clarification is needed when the matter focuses on something else than the language in which the work is written.
How is reference given if the source I have used refers to another source?
The starting point is that the student uses primary sources. If the secondary source, i.e., a source by a second author, is used, this must be evident in the text. When using a secondary source, the reference must be made to the source that has been used. The following examples illustrate how references to secondary material are made.
Director Kilpeläinen (Kunelius, 2010) has concluded [– –].
Director Kilpeläinen has in Kunelius’s work (2018) concluded that [– –].
How is an act referred to the first time or later?
Citing an act for the first time in the text:
According to the Act on Financial Aid for Students (1994/65) 15 f §, [– –].
Text text text (Act on Financial Aid for Students 1994/65, 15 f §).
Citing the same act again in the same text:
Text text text text (AFAS 15 f §).
OR
Text text text text (Act on Financial Aid for Students 15 f §).
Citing several sections/paragraphs of law:
(AFAS 15 a §, 15 b §).
Consult your supervisor for the correct referencing style.
What should the reference list include?
The reference list consists of four elements
Author. (time). Title. Origin.
For example:
Kunelius, R. (2010). Viestinnän vallassa. Alma Talent Oy. http://urn.fi/URN:ISBN:978-952-476-823-8
Should the reference list end with a full stop?
After each element there is a full stop except if the element itself ends with a full stop, an exclamation point or a question. No full stop is added after URLs. An automatic line break inserted into the link by Word. However, the author should not manually insert line breaks into URL links in order to ensure that the link functions in accordance with the accessibility requirements in the final work. No full stop is added if the element itself ends with one, for example Surname, A.A.
How is a reference written if the source does not have a permanent identifier?
In such a case, the reference entry must include the retrieval date on which the source was viewed so that the reader can compare whether the page has been updated since then. Additionally, the phrase “Retrieved from” is placed before the URL, e.g., as follows:
Piippo, I., Vaattovaara, J. & Voutilainen, E. (2016). Kielen taju. Retrieved 2020-04-17 from the address http://www.imafi.fi/imafi_dokument/HVVSHyhteenveto%20Uusi
Should the reference list include edition or place of publication?
If the information on the edition is available, it can be written e.g., as follows:
Surname, A.A. (Year). Title (edition). Publisher. https://doi.org/10.xxx
The place of publication is not included.
How is the date written in the reference list?
In Finnish texts dates are written as they are in accordance with rules of the language, day. month. year (12.3.2021). In English, dates follow the English language model, i.e., dates are written as follows: year-month-day (2021-03-12).
When is the ISBN number used in the reference list?
If the ISBN number is known, it can be mentioned but this information is not obligatory.
Some articles do not have a DOI/URN-link or the link does not work. There are also articles that can only be read using the University of Vasa user ID and password. How are these kinds of sources included in the reference list?
All articles do not necessarily have a permanent identifier (DOI or URN). In this case the information given is Retrieved xxxx-xx-xx from and the URL. If the URL does not function, there is no point to include it in the reference list. However, all working web addresses or addresses with a permanent identifier must be included in the reference list as hyperlinks so that the text is accessible. If passwords or user IDs are required, the limited accessibility must be mentioned (see the writing guidelines).
Must the data sources be listed separately?
All sources including data sources are listed alphabetically in the reference list.
How should laws be written in APA style in the reference list?
Theses in the discipline of law do not use APA style referencing but referencing which is specific to the discipline. In the legal disciplines, acts are completely excluded from the reference list due to the dogmatic method.
In other disciplines, acts are included in the reference list, but the APA style must be adapted for example as follows:
The Act on Financial Aid for Students 21.1.1994/65. Finlex. Retrieved 2020-11-17 from https://finlex.fi/fi/laki/ajantasa/1994/19940065#L2P15b
The safest practice is to verify the appropriate referencing style with your own supervisor.
- Uusimmat päivitykset
-
Kirjoitusohjeiden Word-dokumentin päivitykset 6.3.2024
- Kirjoitusohjeisiin on lisätty luku 4.8 Tekoäly (s. 49), jossa kerrotaan, miten tekoäly merkitään lähdeluetteloon, jos sitä on hyödynnetty esimerkiksi kuvan, kuvioiden tai taulukoiden luomisessa tai muokkaamisessa.
- Kirjoitusohjeisiin on lisätty tieto siitä, että mikäli kuva, kuvio (s. 15), taulukko (s. 16) tai koodi (s. 20) on luotu tai muokattu tekoälyä hyödyntäen, kirjoitetaan käytetty kehote ja tieto tekoälyn hyödyntämisestä kuvatekstiin, taulukkoselosteeseen tai selitetekstiin. Sovellettava malli on kirjoitusohjeiden Word-dokumentin sivulla 15.
- Kirjoitusohjeiden ohjeistusta on muokattu niin, että tieto rajatusta pääsystä kirjoitetaan pienellä alkukirjaimella [rajattu pääsy] tai englanninkielisissä teksteissä [restricted availability] (s. 39).
- Kirjoitusohjeiden lähdeluettelo on muokattu vastaamaan APA-tyyliä. Lähteiden, kuten artikkelin nimien, otsikoissa käytettyjen sanojen alkukirjaimet kirjoitetaan pienillä alkukirjaimilla, vaikka alkuperäisessä lähteessä olisi kirjoitettu isolla alkukirjaimella.
Kirjoitusohjeiden Word-dokumentin päivitykset 28.4.2023
- Kirjoitusohjeisiin on lisätty tieto siitä, että lähdeluettelossa aakkostuksessa ei huomioida artikkeleita a, an ja the. Lähteet aakkostetaan ensimmäisen merkityksellisen sanan mukaan (s. 37).
- Kirjoitusohjeisiin on lisätty tieto siitä, että lähdeluettelossa kursivoidaan lehden nimi eikä artikkelin nimeä (s. 41).